What CO₂ actually tells you about your starter
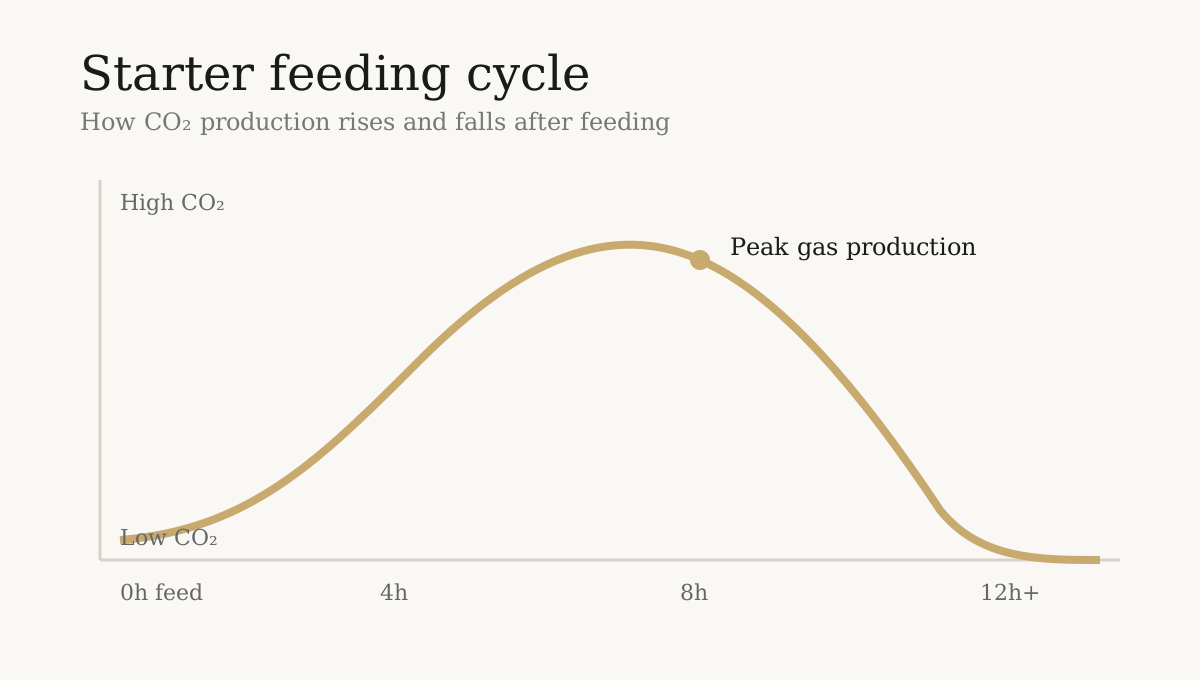
Most home bakers use smell, bubbles, or the float test to guess if a starter is ready. Those signals are useful, but they are indirect. The most direct signal is CO₂ production over time: how fast gas builds after feeding, when it peaks, and how quickly it fades.
1) The rise is a timeline, not a score
A high rise does not always mean a strong starter. What matters is the shape of the curve after feeding. Healthy cultures usually show a clear ramp-up, a peak, then a slow decline. If the rise is random, delayed, or flat, fermentation is unstable.
2) Temperature changes the whole curve
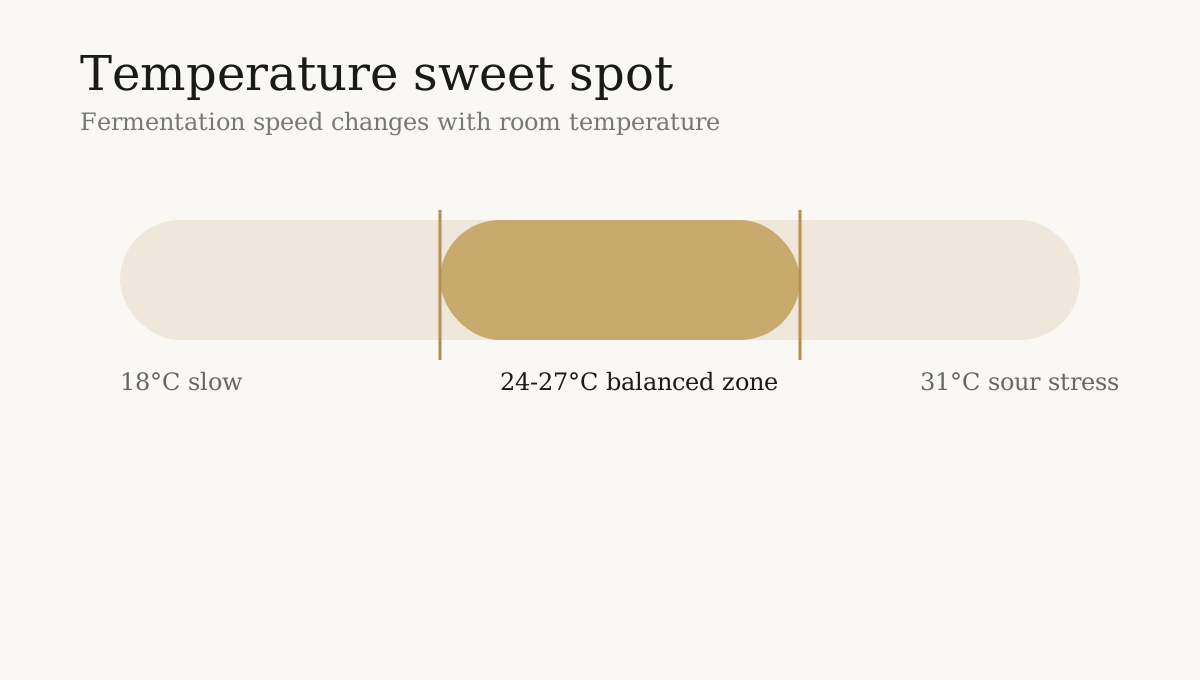
At lower temperatures, gas production slows and the peak comes later. At very high temperatures, activity can look fast but become unbalanced and too acidic. For most flour mixes, a moderate room temperature gives the most predictable cycle.
3) Why float test can mislead
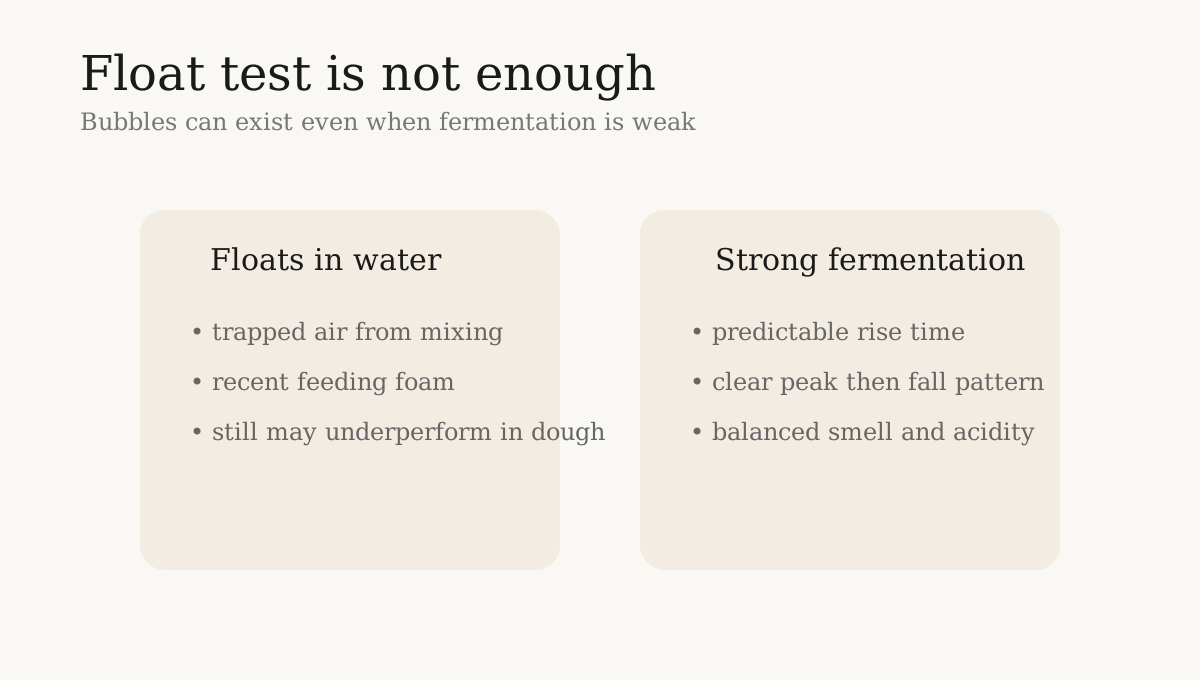
Floating means there is trapped gas, but trapped gas does not always mean strong fermentation power in dough. A starter can float because of mixing foam or recent feeding, while still underperforming in bulk fermentation.